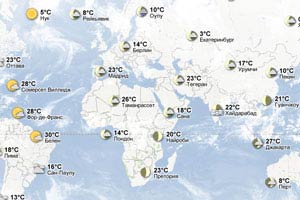
Tangolunda Monthly Weather
Tangolunda Air Temperature, °F
Precipitation Totals, in
Rainy Days During the Year
Average Wind Speed, mph
Sunny, Cloudy and Gloomy Days
Average Sunny Hours Per Day
We are using day length and cloud cover information for each day of the month to calculate averages for this chart.
Mexico Resorts:
NAME
F°
| Acapulco |  |
+86 |
| Cabo San Lucas |  |
+82 |
| Cancun |  |
+88 |
| Cozumel |  |
+86 |
| Isla Mujeres |  |
+86 |
| La Paz |  |
+82 |
| Merida |  |
+100 |
| Playa del Carmen |  |
+86 |
| Puerto Aventuras |  |
+86 |
| Puerto Vallarta |  |
+82 |
| Purerto Escondido |  |
+88 |
| Riviera Maya |  |
+86 |
| Tijuana |  |
+52 |
| Tulum |  |
+84 |
| Veracruz |  |
+82 |
Countries:
NAME
POPULARITY
24 Hours Weather Forecast
Tangolunda
Local time: 14:53
19 feb, thursday
| 1500 |  |
90°F | NE 15 mph |
| 1800 |  |
82°F | NE 11 mph |
| 2100 |  |
76°F | E 6 mph |
20 feb, friday
| 0000 |  |
72°F | E 5 mph |
| 0300 |  |
70°F | E 6 mph |
| 0600 |  |
70°F | SE 5 mph |
| 0900 |  |
82°F | E 6 mph |
| 1200 |  |
90°F | NE 12 mph |


